The Coin Cabinet
Stock market turmoil in recent days has produced some of the biggest moves in history for EURO STOXX and others (S&P 500) since the 1987 crash.
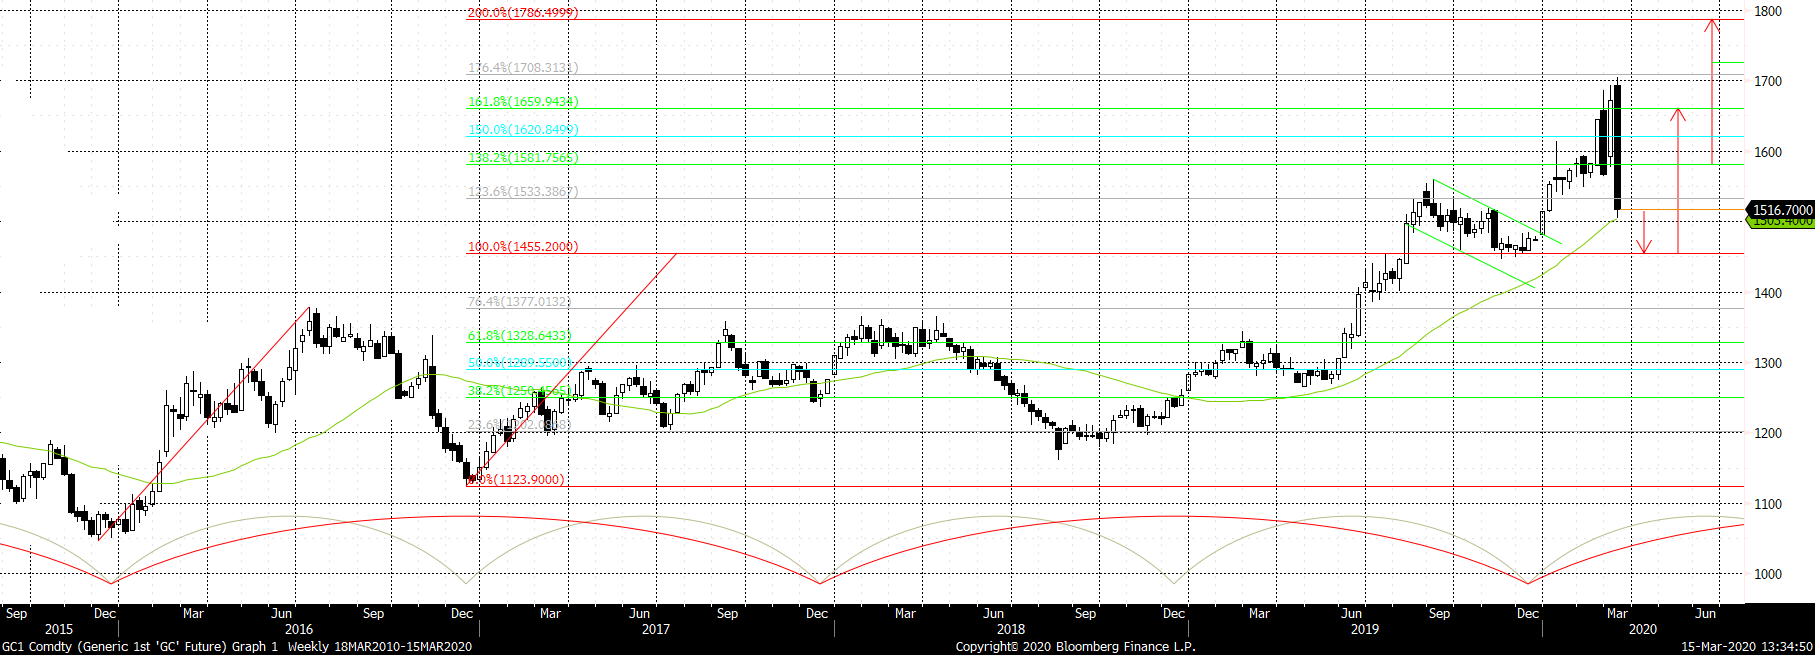
The S&P 500, for example, lost 26.9% at its worst from all-time highs made in February 2020. In this context, gold has also had one-day big declines, most notably at the end of February, dropping $82.00 in one session (5.6% intra-day), followed by another big one-day fall of 4.8%. But within that period gold did reach eight-year highs briefly above $1,700.
Silver has fallen as the economic slow-down is expected to impact industrial demand (fewer phone/laptop purchases) and palladium likewise had a one-day fall of 30% as demand in the auto industry is expected to be lower near-term on a demand/supply shock.
Gold fell as margin calls at the end of February forced speculators to sell gold (their most liquid asset) to raise cash to cover their losses in equity trading. The same was partly true this in the first weeks of February, compounded with professional risk managers reducing risk in all asset classes to preserve cash.
With the US now on a firm footing to cut interest rates (the next Federal Reserve meeting is 18 March), this in turn should weaken the USD and support gold. The USD has seen a rebound in the past few days as concerns around the pandemic have made it the ultimate safe-haven play. However, in time and as the virus narrative subsides, the fundamental story of the USD will continue to be of weakness on a trend basis.
Secondly, benchmark 10-year bond yields in the US and other markets collapsed to all-time lows. US 10-year yields dropped to 0.31%, while 30-year bonds fell below 1.0%. So bonds are not the safe haven they were as the lowering of interest rates in the US takes away their currency advantage on an interest differential (US government bonds at 0.50% and German bonds at -0.50%).
Thirdly, the difference between bond yields and equity dividends (called equity risk premiums) means that more than two-thirds of S&P500 companies have yields higher than US government bonds — equities are now a better returning asset based on dividends, even with falling share prices. But with future earnings likely to be much lower in the next two financial quarters, dividends may fall sharply or not paid out. The result is that gold becomes both a currency play and highly liquid, alternative asset class in which to diversify.
The world’s Central banks will continue to buy gold as a strategic theme. Late in 2019 Germany started accumulating gold for the first time in two decades, while China has an agenda to equal the US in GDP-to-gold ratio — a target of 1,833 metric tons (they have approximately 5,500 tons to go), underlined by Chinese gold imports increasing four-fold since September 2019. Gold is right now near to where it opened at the start of 2020, up only +0.83%, but $1,445 is the 260-day moving average — another $50 away and is a long-term support parameter for a bounce.
Gold remains a hedge against a US slowdown, and a recession-proof asset. Our longer term view is gold will eventually make all-time highs past $1920.60 and have $2,200 as themed target in the next four to five years; close to a 50% rise.

Weekly chart of the gold price, USD, with 39-week moving average and 52 v 104 week cycles (September 2015 — March 2020). Support levels: $1,483, $1,455/45, $1,380
(Photo: The Royal Mint, 2020)